Editing Table Data
Only in DbVisualizer Pro
This feature is only available in the DbVisualizer Pro edition.
With the DbVisualizer Pro edition, you can edit table data in the Data tab grid; click a cell value to start editing. Edits are saved in a single database transaction, which ensures that either all changes or none are committed. The editing feature supports saving binary and large text data, and it shows common data formats in dedicated viewers, such as image, PDF, XML, and HEX.
Opening the Data tab
To open the Data tab for a table:
- Locate the table in the Databases tab tree.
- Double-click the table node to open its Object View tab.
- Open the Data sub-tab.
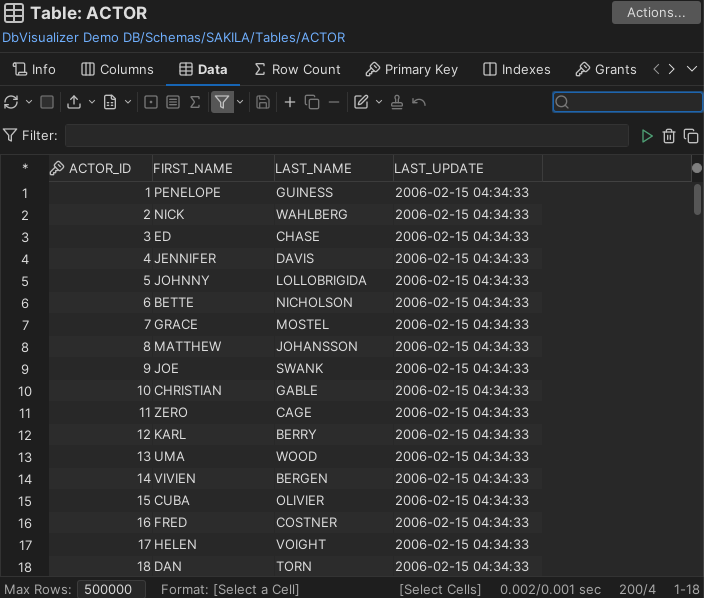
Each column width is automatically resized to match the column width, including the column header, by default. You can disable this behavior in the the Tool Properties dialog, in the Grid category under the General tab.
If Auto Resize Column Widths is enabled, the Max Column Width setting can be used to limit the column width so that an extremely wide column does not take up all space.
Editing data in the grid
To edit a column value:
- Select the column cell.
- Type the new value, or double-click the cell to modify the current value.
- Click the Save toolbar button to update the database.
You can also use the Set Selected Cells drop-down menu to set multiple column values to common values like NULL or the current date and time.
To add a new row:
- Select the row directly above where you want to insert the new row.
- Click the Add Row toolbar button.
- Enter values for the columns.
- Click the Save toolbar button to update the database.
To duplicate a row:
- Select the row you want to duplicate.
- Click the Duplicate Row toolbar button.
- Edit at least the key column values to maintain uniqueness.
- Click the Save toolbar button to update the database.
To delete one or more rows:
- Select the rows you want to remove.
- Click the Delete Rows toolbar button.
- Click the Save toolbar button to finalize the removal in the database.
If you change your mind, you can undo your pending edits:
- Select the cell(s) you want to revert.
- Click the Undo toolbar button.
Reverting all cells in a row marked as Insert or Duplicate removes the uncommitted row from the grid entirely, while undoing a row marked as Delete clears its deletion state. Undoing updated cells reverts them to their original values.
Copy and paste
You can copy selected cell values with the Copy Selection right-click menu choice or the corresponding keyboard shortcut (Ctrl+C or Command+C by default). The data in the clipboard can then be pasted either elsewhere into DbVisualizer or into an external application.
The column and newline delimiters used for copy and paste operations in the grid editor are defined by the Copy Grid Cells in CSV Format settings in Tools → Tool Properties under the General / Grid category. The default settings are sufficient for most use cases.
The grid editor supports pasting data directly from major spreadsheet applications, such as Google Sheets, Microsoft Excel and OpenOffice Calc. The editor handles pasting both single data cells and larger data blocks. Copying and pasting binary data is transparent between separate grids or within the same grid. You can also copy binary files within your operating system's file browser and paste them directly into a cell in DbVisualizer (provided the target cell supports a binary type).
| Copy from spreadsheet | Paste into DbVisualizer grid | |
|---|---|---|
A block of cells is copied  | The block is pasted into the selected region 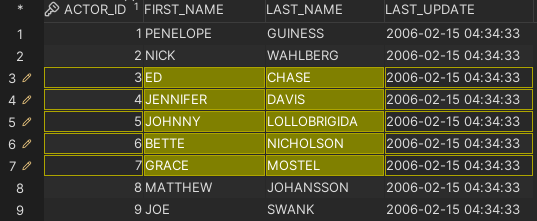 | |
| A block of cells is copied | The block cannot be pasted into a different number of target cells 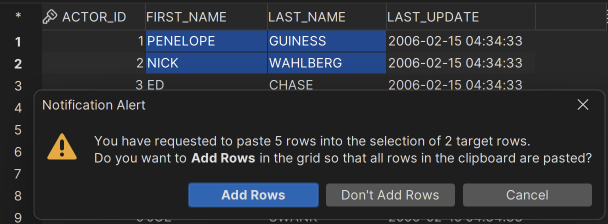 | |
A single cell is copied  | Paste into selected target cell  | |
| A single cell is copied | Paste and fill the single column target selection  | |
Multiple cells in a single row are copied  | Paste and fill the target selection 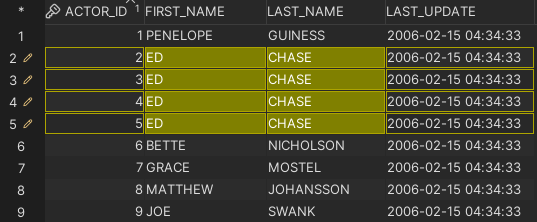 |
Updates and deletes must match only one table row
When you update or delete rows, DbVisualizer ensures that only one row in the table is affected. This safety check prevents changes in one row from silently altering data across other rows. DbVisualizer uses the following strategy hierarchy to determine the uniqueness of an edited row:
- Primary Key
- Unique Index
- Manually Selected Columns
A primary key uniquely identifies each row in a table. If the table has a primary key defined, DbVisualizer uses it automatically. If no primary key is defined, DbVisualizer checks for a unique index. If multiple unique indexes exist, DbVisualizer selects one of them. If there is no primary key or unique index defined for the table, you must manually choose which columns to use as the unique constraint. The Key Column Chooser is displayed automatically if the key columns cannot be determined by the application.
Key column chooser
Normally, database tables have a primary key or at least one unique index, making editing straightforward. However, if there is no native way to uniquely identify rows in a table, you must manually define which columns DbVisualizer should track.
While saving modifications, DbVisualizer checks that there is an active method to identify unique rows. If this cannot be accomplished, the following dialog is displayed:

The Key Column Chooser can also be opened manually at any time. Right-click inside the data grid and select Edit Table Data → Key Column Chooser. It is also available from the Key Column(s) button in the Save Result(s) error dialog.
If the database request to save your edits cannot uniquely identify the single row that should be modified, an error dialog is displayed and the uncommitted editing state is maintained for that row in the grid editor.
Editing multiple rows
The grid editor supports modifying multiple rows and saving all changes together in a single database transaction. Edited rows are flagged with status icons in the row header:
Cell(s) in the row have been edited
Row is new
Row is duplicated from another row
Row is marked for deletion (further edits are not allowed)
Data type checking
When navigating away from an edited cell, the new value is validated against the data type of the column. If a validation error occurs, the following dialog appears:
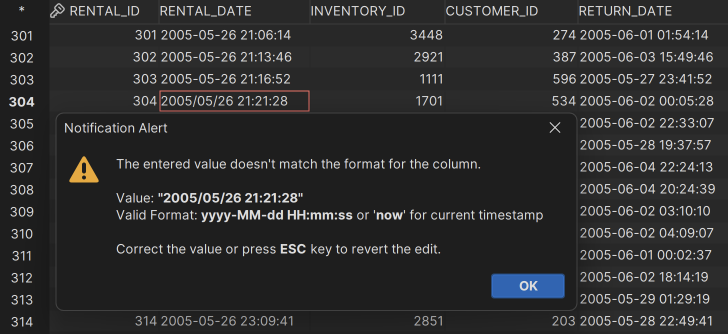
Newline and carriage return
If a cell in the grid or record editor contains newline, carriage return, or tab control characters, they are visually represented in the grid interface. However, an informational warning dialog appears whenever you attempt to edit such a value directly to prevent accidental text malformation:

Grid viewers
Data in grids can be shown in three viewers:
- Value viewer: Displays the contents of a single selected grid cell. Depending on the data type, it shows a text, image, XML, JSON, serialized Java object, or HEX viewer.
- Record viewer: Displays all column values for the selected row in a transposed layout, with columns shown as rows.
- Aggregates viewer: Displays aggregates (such as sum, count, and average) for the grid selection.

By default, these viewers are shown as tabs to the right of the grid. To show them in separate windows instead, change the layout in Tools → Tool Properties under General / Grid / Grid Viewers.
Value viewer
The value viewer displays the selected grid cell value in a format that matches its content type. The following viewers are available:
- Text
- XML
- JSON
- Image (GIF, JPEG, PNG, TIFF, BMP, SVG)
- Serialized Java Object
- HEX
- Date, Time, and Timestamp (with choosers when editing)
You can open the value viewer in any of these ways:
- Click the grid toolbar button:
- Select Value Viewer from the grid's right-click context menu.
- Double-click a CLOB or binary cell.
- Double-click a text cell that contains newline or tab characters.
- Double-click a cell that has been truncated due to the Max Chars setting (configured in Tools → Tool Properties under the General / Data Formats category).
The following example shows the value viewer to the right of the grid:

Here, a binary cell is selected in the grid. The value viewer detects the content type and shows the matching viewer, in this case a text editor.
Click the leftmost eye icon to show a list of all viewers:

Only viewers supported by the selected cell's data type are enabled.
- Show Metadata: Displays a pane at the bottom of the value viewer with database type information for the cell.
- Auto-detect Viewer: When enabled, shows formats like XML and JSON in a graphical viewer rather than a text editor.
You can also drop a file on the value viewer to load its contents.
For more value viewer settings, open Tools → Tool Properties and check the General / Grid / Grid Viewers category. For example, you can use the text editor font in the value viewer, which helps if you often work with values that contain code.
Editing in the value viewer
When editing is supported by the underlying dataset, changes made in the data grid propagate immediately to the value viewer, and vice versa.
Editing JSON values
By default, the value viewer shows JSON as a tree (when Auto-detect Viewer is on). To modify a JSON value, you can either edit the whole value directly within the main data grid cell or edit specific nodes by double-clicking the corresponding cell inside the tree view.
For advanced modifications, click the Text Editor button in the top-right corner of the JSON tree view. This switches to a text editor where you can edit the JSON value as text. To customize the fonts and styles for this editor, navigate to Tools → Tool Properties and select the General / Appearance / Editor Styles section. Open the Token Styles tab and choose JSON from the Syntax drop-down menu.
Record viewer
The record viewer displays the selected grid row in a transposed ("rotated") view, presenting the original columns vertically as rows. This layout is useful for grids with many columns.
You can open the record viewer in any of these ways:
- Click the grid toolbar button:
- Select Record Viewer from the grid's right-click context menu.
- Double-click the row number to the left of the corresponding grid row.
The following example shows the record viewer displayed to the right of the grid:

The Key column displays a key icon for primary key columns, while the Name field corresponds to the column's header in the grid. The Value field displays the data for each column.
For CLOB and binary data types, the Value field displays an icon and the size of the data. To view or modify this data, double-click the cell to open the value viewer in a separate window, or click the icon in the toolbar. You can adjust the data format in Tools → Tool Properties under the General / Data Formats category.
The navigation buttons in the toolbar let you step through the rows in the grid, updating the record viewer.
To view detailed database metadata for a specific column - such as the data type, nullability and so on - hover over the Name field.
For additional settings related to the record viewer, open Tools → Tool Properties and check the General / Grid / Grid Viewers category.
Editing in the record viewer
When editing is supported by the underlying data set, modifications made in the grid propagate immediately to the record viewer, and vice versa. Pending edits inside the record viewer are highlighted using the same status colors as in the main grid.
Previewing changes
You can preview the SQL statements that will be executed before finalizing your edits. To do so, open the right-click context menu in the grid and choose Edit Table Data → SQL Preview.
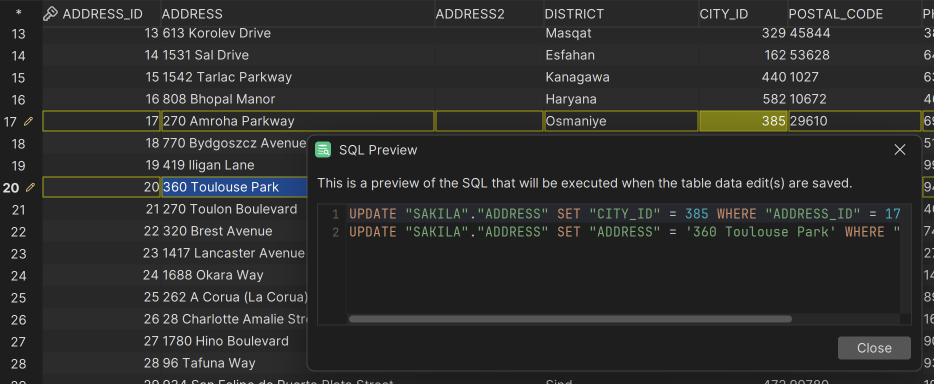
The listed SQL statements may not be 100% identical to the exact statements sent to the database server, as the save process uses variable binding to pass values to the database.
Viewing and editing binary/BLOB and CLOB data
Values of binary/BLOB and CLOB types can only be fully modified and inspected inside the value viewer. (There is partial support in the record viewer to view image data and to load data from a local file).
In the standard grid view, binary/BLOB and CLOB data fields are represented by an icon accompanied by the total byte size of the value. You can select an alternative presentation format in Tools → Tool Properties under the General / Data Formats category. Selecting By Value or Image Preview reduces performance and increases memory consumption significantly.
The Image Preview option for BLOB types renders a downscaled image thumbnail directly inside the grid if the underlying binary object matches a supported image format. You can set the thumbnail size in the same category.
In the same Tool Properties section, you can specify how the clipboard handles Copy/Paste and Drag and Drop operations when pasting binary payloads into target components that do not natively support binary objects.
You can edit binary data by importing it from a file or by using the text editor in the value viewer. You can also copy a file inside your operating system's native file browser and paste it directly into a target BLOB/CLOB cell.
Binary data within DbVisualizer serves as a generic term for several common binary database data types:
- LONGVARBINARY
- BINARY
- VARBINARY
- BLOB
Document data
DbVisualizer offers additional specialized grid features when working with document-oriented databases. Check Working with Document Data for more information.